Deutsch

|
| Home |
| Contact |
| μGrain: |
| Infos |
| Downloads |
| Order |
| AnaMark: |
| Infos |
| Downloads |
|
|
 Micrograph
Processing and Analysis Tool
Processing and Analysis Tool
μGrain covers the basic range of image analysis functions required by metallurgy labs:
- Automatic calibration and image correction
- Image processing and automatic image optimization
- Dimensioning and labeling of images
- Phase and grain size analysis (Line intercept analysis, ASTM E112)
- Manual and automatic phase analysis (ASTM E562, ASTM E1245, ISO 9042,...)
- Reporting your results
- Customized functions
μGrain is designed to deal with optical microscopes and micrographs which are anything but perfect, as is shown in the example images below.
Like graphic software, μGrain is independent of an image capture system. μGrain can be linked to most image capture systems, so that you can work almost as if it was one integrated system. It can thus be a software upgrade for older systems; for current systems it may be a beneficial alternative to buying separate dimensioning, image processing and phase analysis modules.
Interested? Simply get the free demo version.
The following gives a short summary of the possibilities of μGrain:
Automatic calibration and image correction
|
To dimension images correctly, the size of a pixel has to be specified for each magnification in use once when setting up the software. μGrain can evaluate images of stage micrometers automatically. The calibration is thus independent from the user. In addition, chromatic aberration can be detected and corrected automatically. Especially for older optical microscopes, the image quality (reduction of color fringes) and the accuracy of the scale (reduction of image distortion) improves significantly: Top: Original image (error in dimensions ≈ ±3,7%) Bottom: After calibration (error in dimensions ≈ ±0,6%) |
|
|
For comparison: e.g. ASTM E112 allows not more than ±2% error in dimensions. The reduction of color fringes clearly sharpens the image: Top: Original image Bottom: After automatic image correction |
|
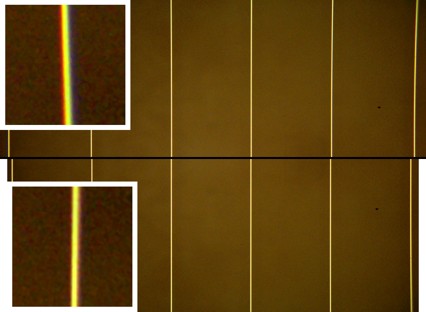
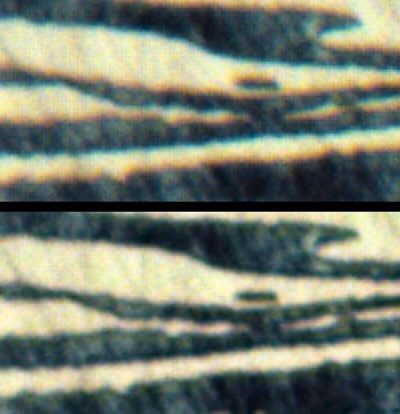
Image processing and automatic image optimization
|
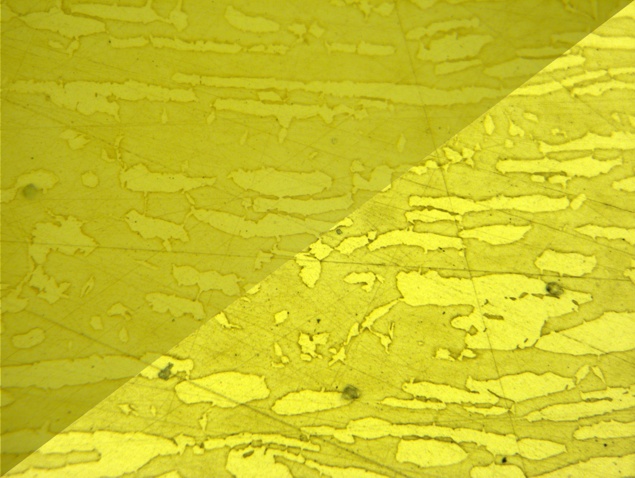
μGrain can correct inhomogeneous illumination automatically. This function is based on a physical model of an optical microscope; thus it does not require calibration but can be used immediately for each image. Even images showing pale colors and weak contrasts benefit from this ability and show clear contours: Top left: Original image Bottom right: Automatic brightness and contrast adjustment for optical microscopes |
|
|
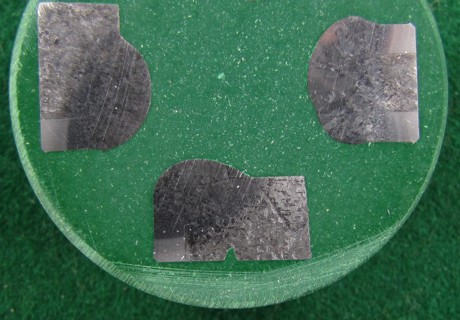
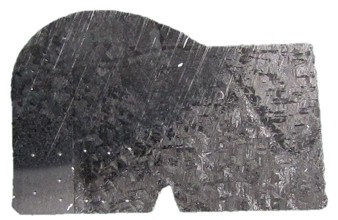
μGrain provides further functions for image processing. These are specially designed for the needs of metallography and specimen documentation, as e.g. cutting-out objects or image parts: Top: Original image showing three specimens Bottom: Result of cutting-out the bottom specimen. The function just requires two mouse clicks: one to mark the background and one to select the object. |
|
Dimensioning and labeling of images
|
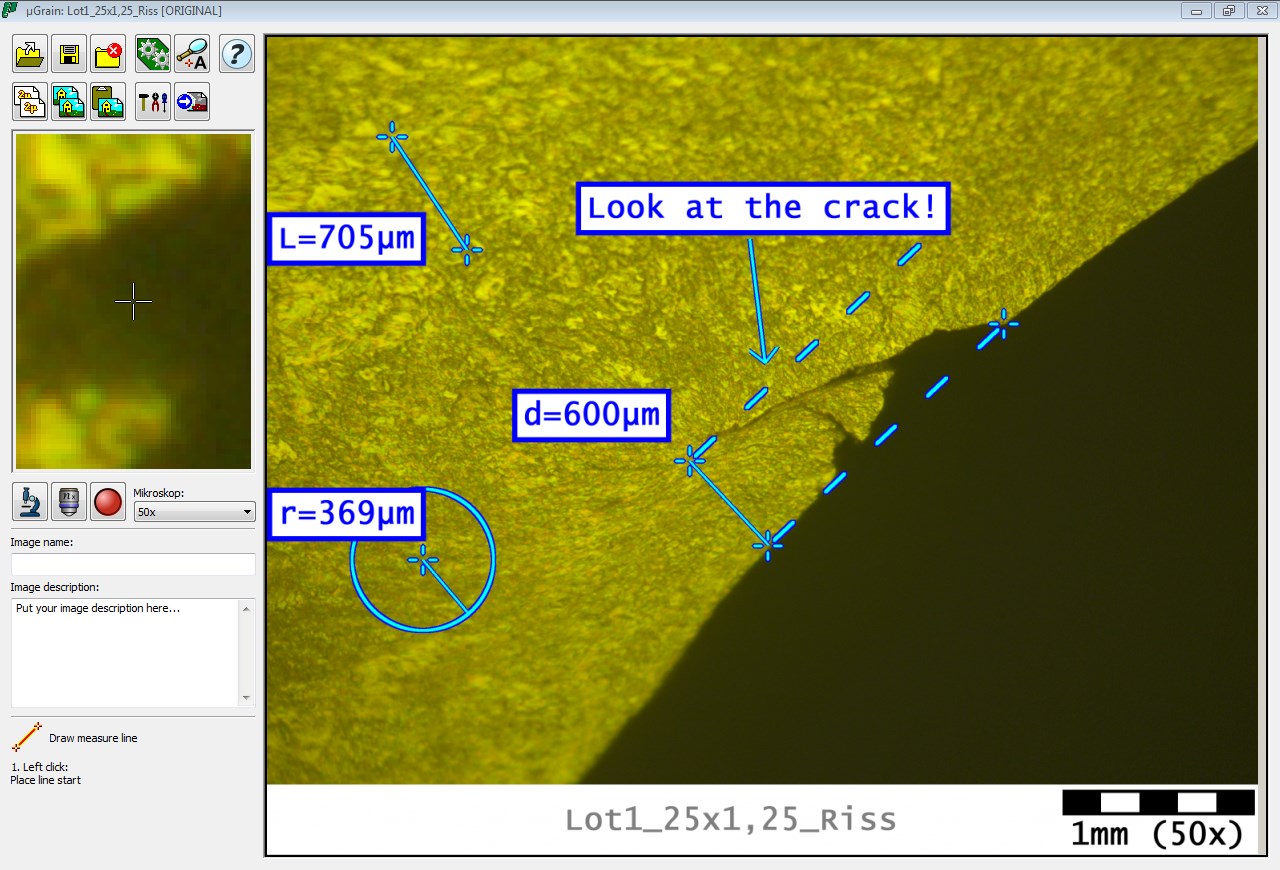
Measurement of distances or radii, drawing arrows, adding comments to images is simple:
Besides the scale, you can put your company logo or an image title in the footer of your images. |
|
Phase and grain size analysis (Line intercept analysis, ASTM E112)
|
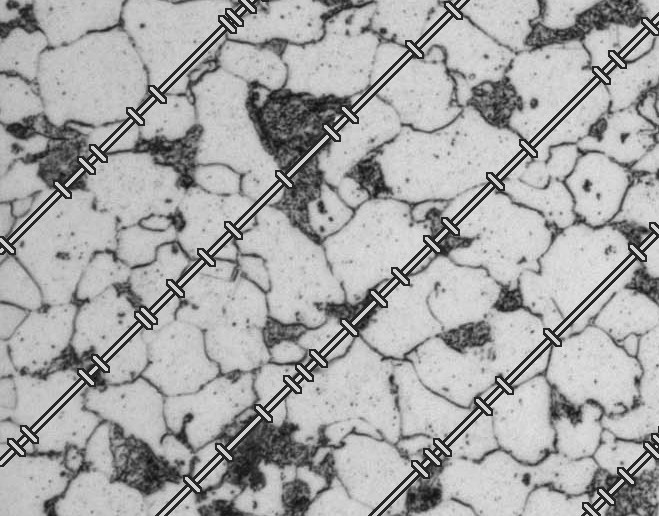
For grain size analysis using line intercept method, μGrain provides three autodetect-algorithms:
All algorithms are available in specialized modifications for pure phase size analysis (e.g. for austenite spacing of duplex). The evaluation is performed for the whole as well as per-phase which renders this an alternative for phase fraction estimation. Supported standards:
|
|
Phase analysis (ASTM E562, ASTM E1245, ISO 9042,...)
|
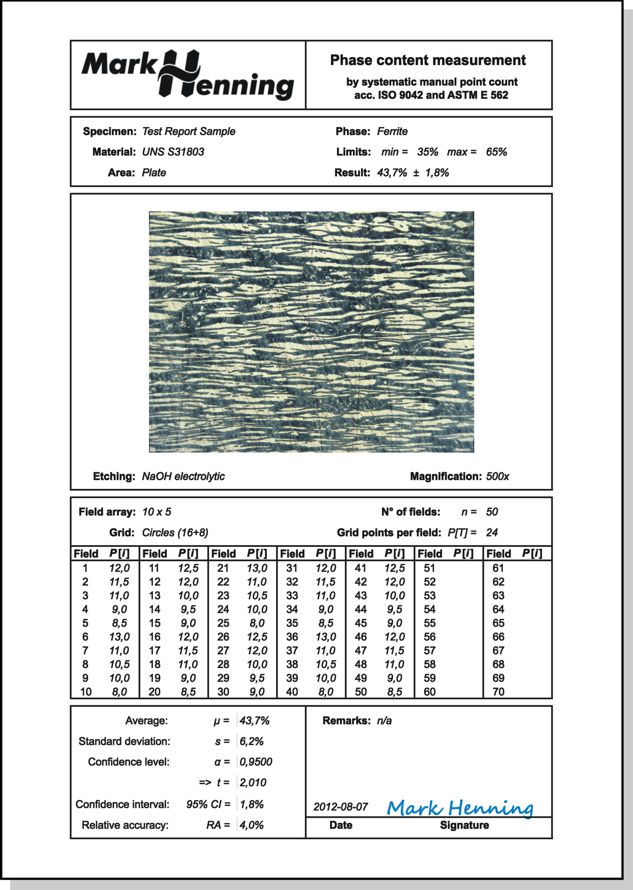
Sometimes, phase analysis tends to be a boring job. Who e.g. frequently performs manual point counting to estimate the ferrite content of weld seams in duplex stainless steel, can tell you a thing or two about it. μGrain gives you an ergonomic procedure and full software support (automatic phase analysis) for point counting while maintaining full compliance to ASTM E562 / ISO 9042 which require a manual point counting! In parallel, the results are evaluated statistically. You see immediately when the required accuracy is reached so that no time is wasted for needless further point counting. |
|
|
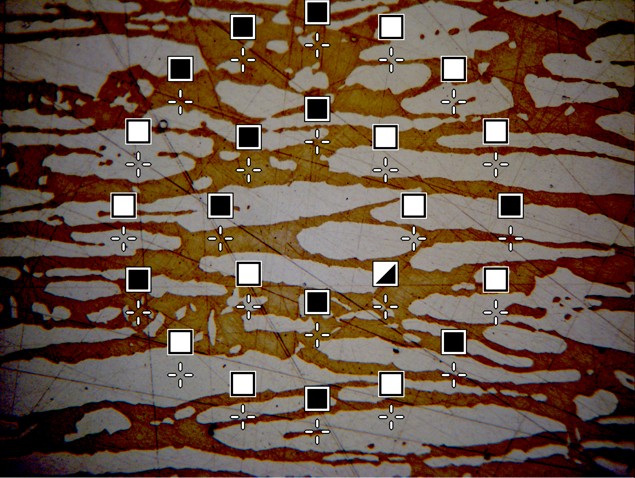
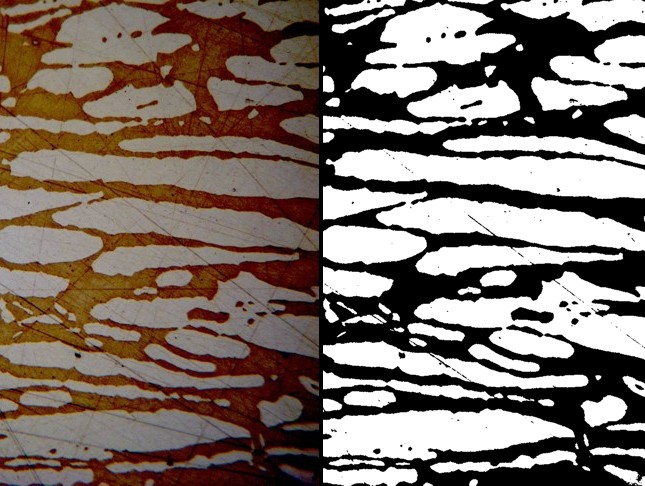
Phase analysis can be performed on the complete image, on parts of the image or at distinct measurement points. The phase detection can be manual, semi-automatic or fully automatic - without the need to manually define a threshold value between both phases. This minimizes the user factor. The μGrain algorithm is auto adaptive: The phase detection also works if brightness or colorization are inhomogeneous or contrast is weak.
Left: Original image having inhomogeneous brightness and colorization
Right: Result of fully automated phase analysis Supported standards:
|
|
Reporting your results
|
You can export your results on many ways, for example to Microsoft Excel or OpenOffice Calc using μGrain's predefined or user-defined templates. |
|
Customized functions
You need a special function, which is currently not implemented in μGrain? You would like to have image processing algorithms adapted to your kind of images?
Just contact our support!